

Summary
- Five years ago I called Smart Sand “extremely undervalued” at $2.09. The stock now trades at $3.91, an 87% return.
- The company survived the downturn, competitor bankruptcies, and Northern White sand’s market share collapse.
- Low-debt, low-cost structure proved its worth; volumes nearly tripled from 1.9M to 5.3M tons.
- However, contribution margins fell from $21/ton to $14/ton due to in-basin competition. This appears structural.
- While upside remains, this is no longer the screaming cyclical buy it was in 2020. Better opportunities exist elsewhere.
Revisiting the Thesis
If I tell you that Smart Sand (SND) has delivered an 87% return since my January 2020 article, you might think the thesis worked out well. And in some ways, it did. But the full picture is more nuanced, and as a cyclical investor, I owe you an honest assessment of what went right, what went wrong, and where we stand today.
In 2020, I argued that Smart Sand was an extremely undervalued cyclical pick with enormous upside potential. The stock had declined 81% from its IPO price of $11 to just $2.09. Price-to-Book was 0.36x. The frac sand industry was in turmoil, with Northern White sand losing market share to cheaper in-basin alternatives. But I believed Smart Sand’s low-cost, low-debt structure would allow it to survive the downturn and emerge stronger when conditions improved.
The Expected Market Value from my four scenarios was $236 million, implying 174% upside from the $86 million market cap. Today, the market cap is about $152 million. So we captured about 77% of the value, but we didn’t hit the main scenario target.
What happened?
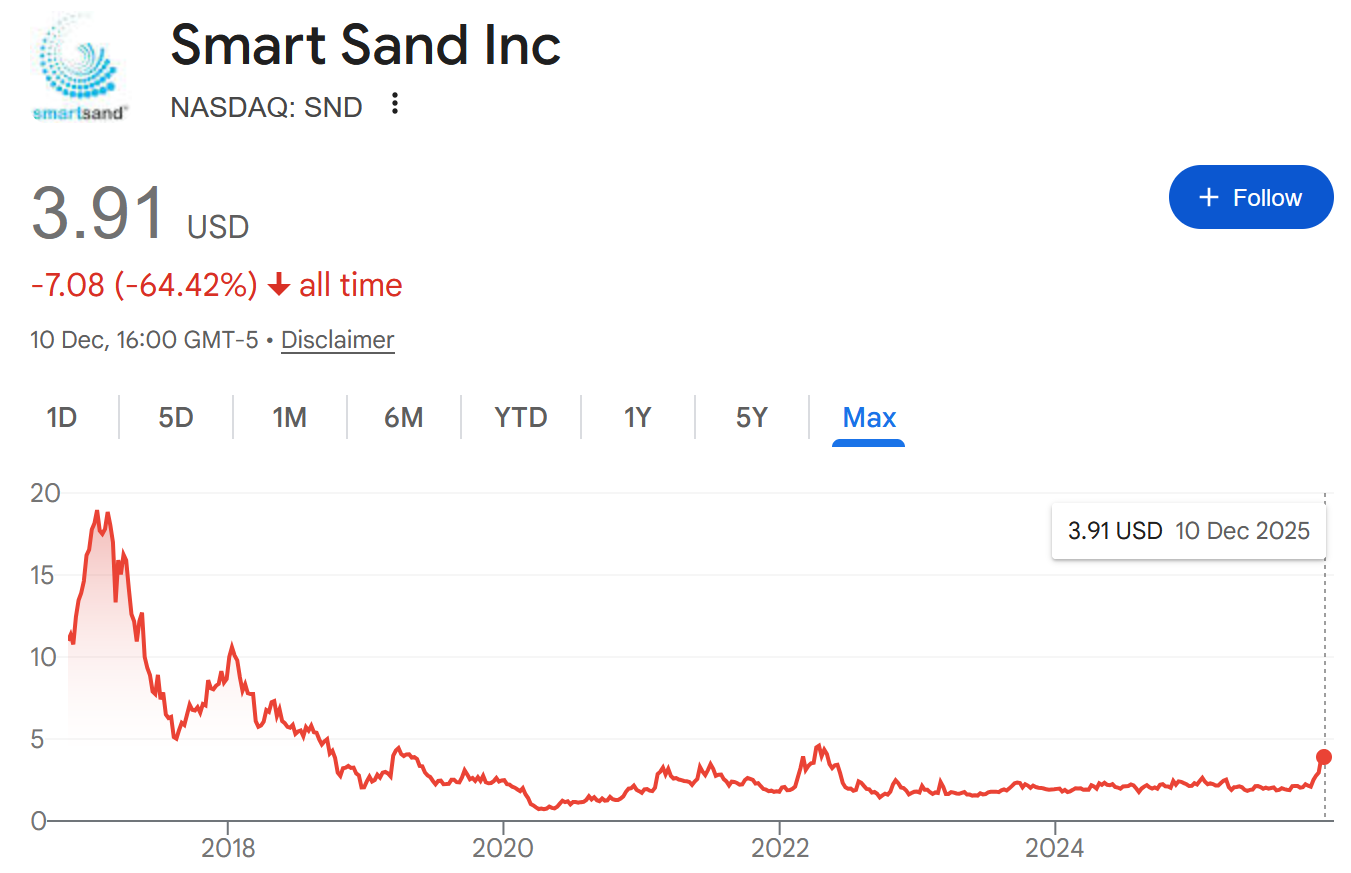
 Smart Sand stock from IPO through 2025. The 2020 article was written near at $2.09.
What Went Right
Survival: This was the core bet, and it paid off. Smart Sand navigated the COVID-induced oil crash of March 2020, when crude briefly went negative. Competitors Hi-Crush and Covia both filed for Chapter 11 bankruptcy that summer. Smart Sand not only survived but went on offense, acquiring Hi-Crush’s Blair, Wisconsin facility for just $6.5 million in early 2022. That acquisition added 2.8 million tons of annual capacity and rail access via Canadian National Railway.
Volume Recovery: Tons sold increased from 1.9 million in 2020 to 5.3 million in 2024, a 179% increase. The company achieved record quarterly volumes in Q4 2024 and is guiding to 5.1-5.4 million tons for full year 2025. This exceeded my “good scenario” assumption of 4.5 million tons.
Revenue Growth: Revenue rose from $122 million in 2020 to $311 million in 2024, a 154% increase. The 5-year CAGR is 22%, which is impressive for any company, let alone one in a supposedly dying industry.

What Went Wrong
2021 Was Brutal: What I didn’t anticipate was that 2021 would be the worst year in Smart Sand’s history. The company recorded a net loss of $50.7 million, driven partly by $19.6 million in bad debt expense related to the U.S. Well Services dispute. Contribution margin collapsed to just $3.30 per ton, down from $20.75 in 2020. I assumed things would improve steadily; instead, they got much worse before getting better.
Margin Compression: This is the critical miss. My scenarios assumed contribution margins of $17-24 per ton based on historical performance. The reality? After recovering from the 2021 disaster, margins have stabilized around $13-15 per ton. That’s 30-35% below what I assumed would be “normal.” The culprit is structural: in-basin sand from the Permian and Eagle Ford has permanently reset the competitive landscape.
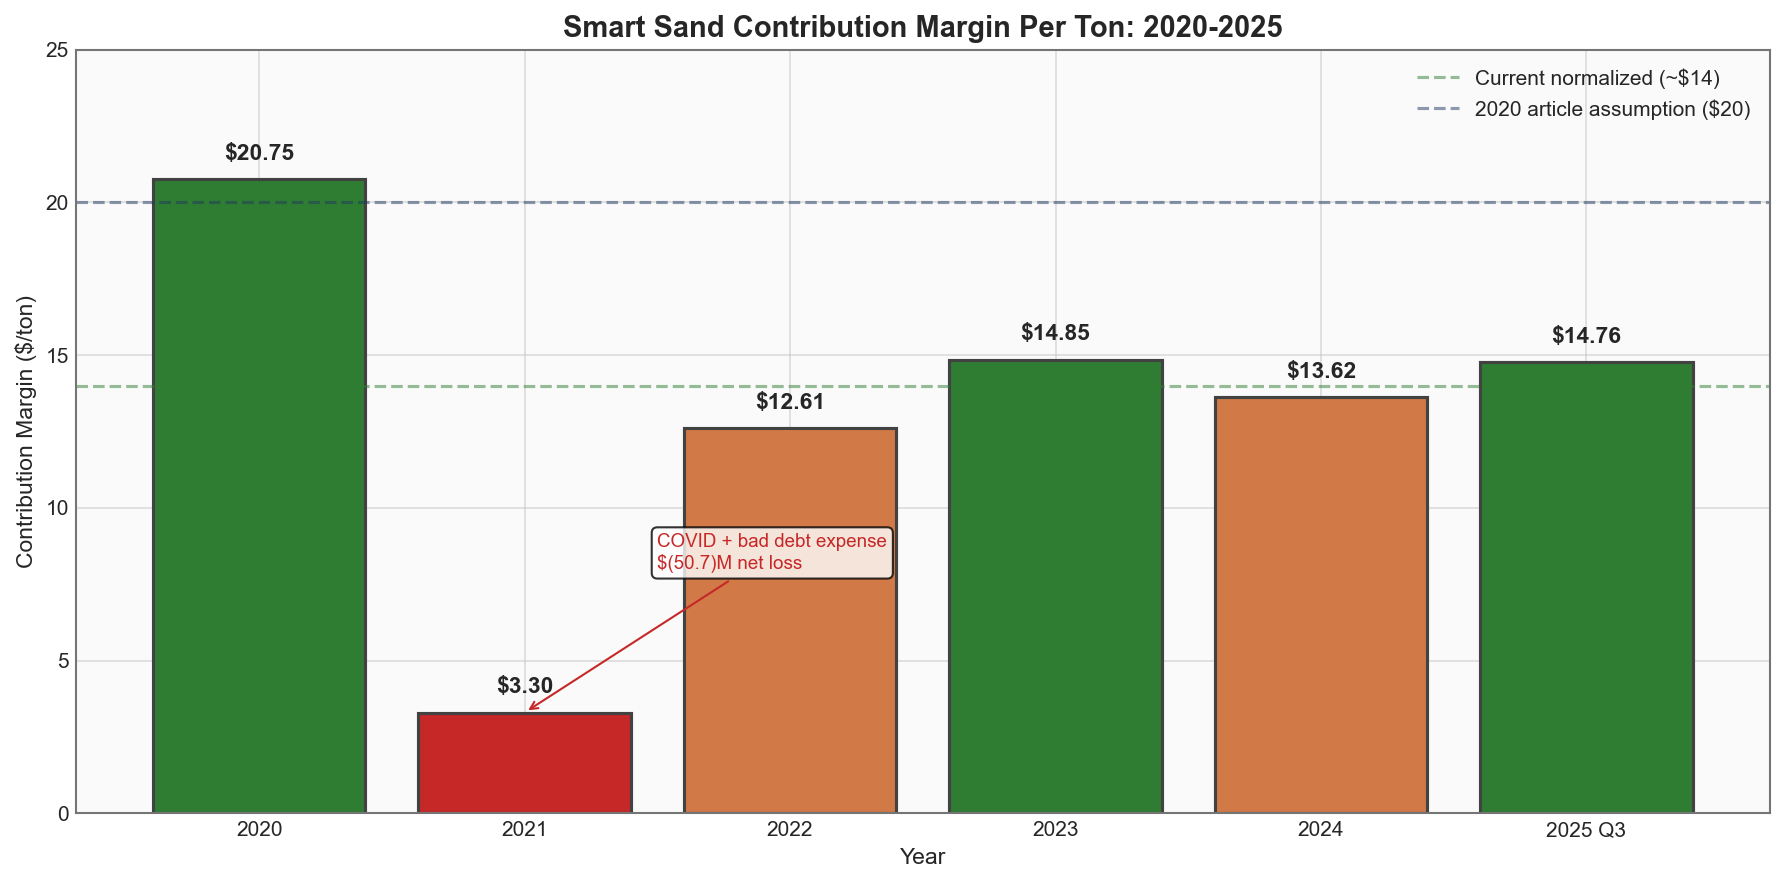
 Margins recovered from the 2021 crash but remain well below 2020 levels.
Northern White’s Decline: The market share shift I acknowledged in 2020 continued more aggressively than expected. Northern White sand’s share of the U.S. market fell from roughly 40% in 2020 to about 20% today. In-basin sand now dominates the Permian (97% adoption) and Eagle Ford (90%), according to industry research. Smart Sand’s addressable market has shrunk considerably.
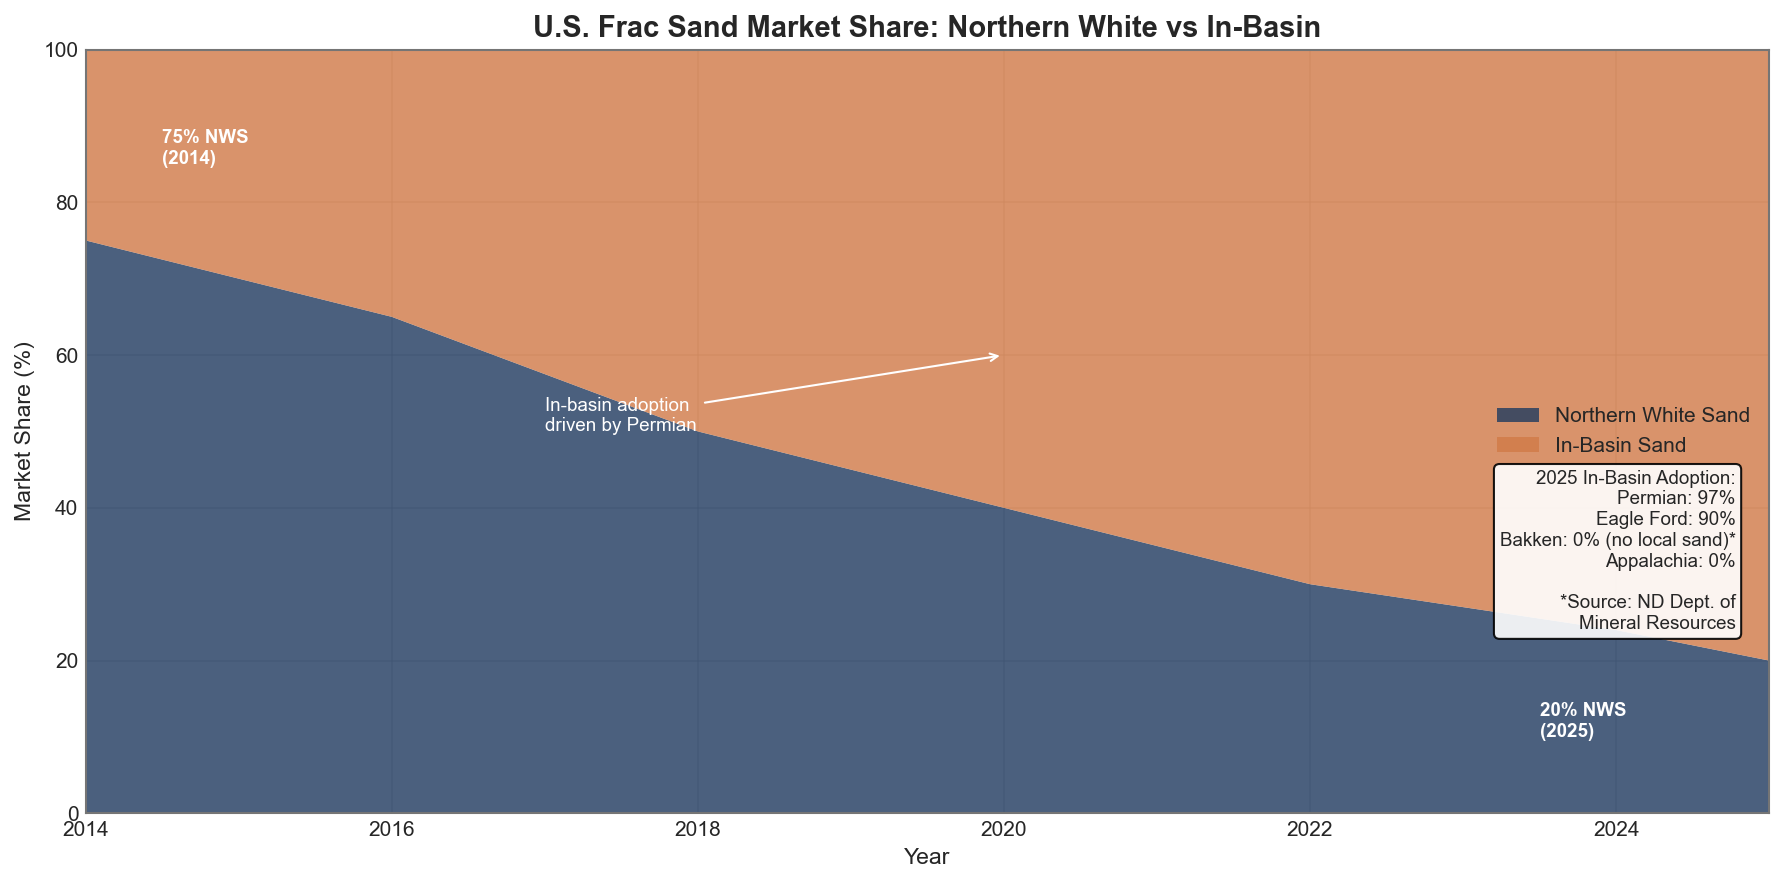
 Northern White sand’s market share continued declining through 2025.
The silver lining: the Bakken and Appalachian basins, which are Smart Sand’s core markets, still have no viable local sand alternatives. According to North Dakota’s Department of Mineral Resources, the Bakken is still evaluating local sand resources, but nothing commercial has materialized. Appalachia’s geology doesn’t support in-basin production at all. Smart Sand retains a protected niche.
The Numbers: What the SEC Filings Actually Say
Let me be precise about the financial trajectory. These figures come directly from Smart Sand’s 10-K and 10-Q filings:
| Year | Revenue ($M) | Tons Sold (M) | Contrib Margin ($/ton) | Net Income ($M) |
|---|---|---|---|---|
| 2020 | 122.3 | 1.886 | $20.75 | $38.0 |
| 2021 | 126.6 | 3.189 | $3.30 | $(50.7) |
| 2022 | 255.7 | 4.333 | $12.61 | $(0.7) |
| 2023 | 296.0 | 4.514 | $14.85 | $4.6 |
| 2024 | 311.4 | 5.263 | $13.62 | $3.0 |
| 2025 (9M) | 244.1 | ~4.4 | $14.76 | $0.2 |
Sources: Smart Sand 10-K annual reports, 10-Q Q3 2025 filing
Q3 2025 was particularly strong: $92.8 million revenue (+47% YoY), 1.47 million tons sold, $14.76/ton contribution margin, and $3.0 million net income. The company declared a $0.05 special dividend and has been buying back shares.
The balance sheet remains clean: $5 million cash, $12.6 million total debt, $30 million undrawn credit facility, and $239.9 million in stockholders’ equity. Book value per share is approximately $6.17, still above the current stock price of $3.91.
Natural Gas: A Tailwind, But Not a Savior
Natural gas prices have been volatile. The 2022 energy crisis sent Henry Hub to an average of $6.45/MMBtu. Then prices collapsed: $2.57 in 2023 and a record-low $2.21 in 2024 (EIA). Currently in late 2025, winter demand has pushed prices above $4/MMBtu, but the year-to-date average is closer to $2.50.
Here’s the key insight: Smart Sand’s revenue recovery wasn’t driven by gas prices. It was driven by volume recovery. Look at 2022: gas averaged $6.45, the highest in years, and Smart Sand’s revenue doubled, but that was mostly volume (+36% YoY). In 2024, gas averaged just $2.21, yet revenue still grew 5%. The correlation between gas prices and Smart Sand’s performance is weaker than you’d expect.
Updated Valuation: Still Upside, But Less Compelling
Using the same scenario framework from 2020, with updated assumptions based on the past five years:
Key Assumptions:
- Operating expenses + Depreciation: $45 million (up from $40M)
- Tax rate: 21%
- P/E Multiple: 12.5x (conservative for cyclical)
- Current Market Cap: $152 million ($3.91 × 38.9M shares)
| Scenario | Probability | Tons (M) | Margin/Ton | Net Income ($M) | Fair Value ($M) | Upside |
|---|---|---|---|---|---|---|
| Main (Base) | 50% | 5.2 | $14 | $22 | $275 | +81% |
| Good | 15% | 5.8 | $18 | $47 | $587 | +286% |
| Stagnant | 25% | 4.5 | $11 | $4 | $44 | -71% |
| Death | 10% | 0 | N/A | $0 | $0 | -100% |
Expected Market Value: $237 million EMV Upside from Current: +56% Implied Stock Price: ~$6.09
 The 2020 scenarios implied 174% upside; 2025 scenarios imply 56% upside.
Notice the shift in probabilities. In 2020, I assigned 20% probability to “death” because the company’s survival was genuinely uncertain. Today, death probability is just 10%. Smart Sand has proven it can survive. But “good” probability is also lower at 15% because structural margin compression limits the upside even in optimistic scenarios.
Why I’m Not Adding Here
The honest assessment: Smart Sand is no longer the asymmetric opportunity it was in 2020.
Then (2020): The stock was at a genuine cyclical trough. Panic was widespread. Competitors were filing for bankruptcy. The company traded at 0.36x book with 20% implied death probability. The setup was classic deep value: hideous sentiment, strong balance sheet, patience required.
Now (2025): The company survived and recovered. The easy money was made. Yes, it still trades below book value (0.63x), but margins are structurally 30% lower than what I assumed would normalize. The “main scenario” offers meaningful upside, but it’s not the 130%+ I saw in 2020.
More importantly, this is not a cyclical trough. Natural gas prices are elevated by winter demand. The company is profitable and generating cash. The extreme discount that justified aggressive buying in 2020 has closed considerably.
Cyclicals are most attractive when nobody wants them and survival is questioned. Smart Sand no longer fits that profile. It’s a reasonably valued small-cap with execution risk, not a mispriced asset with asymmetric upside.
I have better opportunities to deploy capital right now.
Conclusion
My 2020 thesis on Smart Sand got the survival call right, the cyclical rebound right, but was too optimistic on margins and timing. The stock delivered an 87% return, which is respectable but below my target. More importantly, it took five years and required enduring a brutal 2021 where the company lost $50 million.
The company is well-run, generates cash, trades below book value, and has a clean balance sheet. If you’ve held since 2020, you’ve been rewarded for patience, and there’s still moderate upside from current levels.
For new money, I don’t find the entry point compelling. The 56% EMV upside requires the “main scenario” to play out, which assumes steady volumes and $14 margins. That’s not unreasonable, but it’s not the screaming “extremely undervalued” setup I saw in 2020. The margin of safety has narrowed considerably.
Smart Sand embodies what cyclical investing looks like in practice: messy, non-linear, and requiring patience through uncomfortable periods. The thesis was directionally correct, but the magnitude of returns fell short of expectations. That’s a lesson worth remembering for the next cyclical opportunity.
Personally, I have recently completely sold my shares, and profitably adjusted my positioning during very low or higher price. Thus, my performance has exceeded the performance of the stock.
Disclaimer: I have no position in SND and do not plan to initiate one. This article reflects my personal analysis and opinions and should not be construed as investment advice.


Leave a Reply